
hyeonga_code
reProject_51_Chart.js 활용하여 통계 구현하기_1 본문

2024.02.25
관리자 메인 페이지에서 필요한 통계를 Chart.js를 활용하여 작업하기로 결정했다.
-- 공식 문서 사이트를 참조
Chart.js | Chart.js
Chart.js Welcome to Chart.js! Why Chart.js Among many charting libraries (opens new window) for JavaScript application developers, Chart.js is currently the most popular one according to GitHub stars (opens new window) (~60,000) and npm downloads (opens ne
www.chartjs.org
//Chart.js 구성의 최상위 구조

const config = {
	type: "",	// 차트의 종류
    data: {},		// 차트 값
	options: {},	// 차트 옵션
	plugins: []
}
따로 설치하지 않아도 되는 CDN으로 설정하려 한다.
jsp파일에 추가
|
<!-- chart.js --> |
<h2>Chart.js</h2>
<hr>
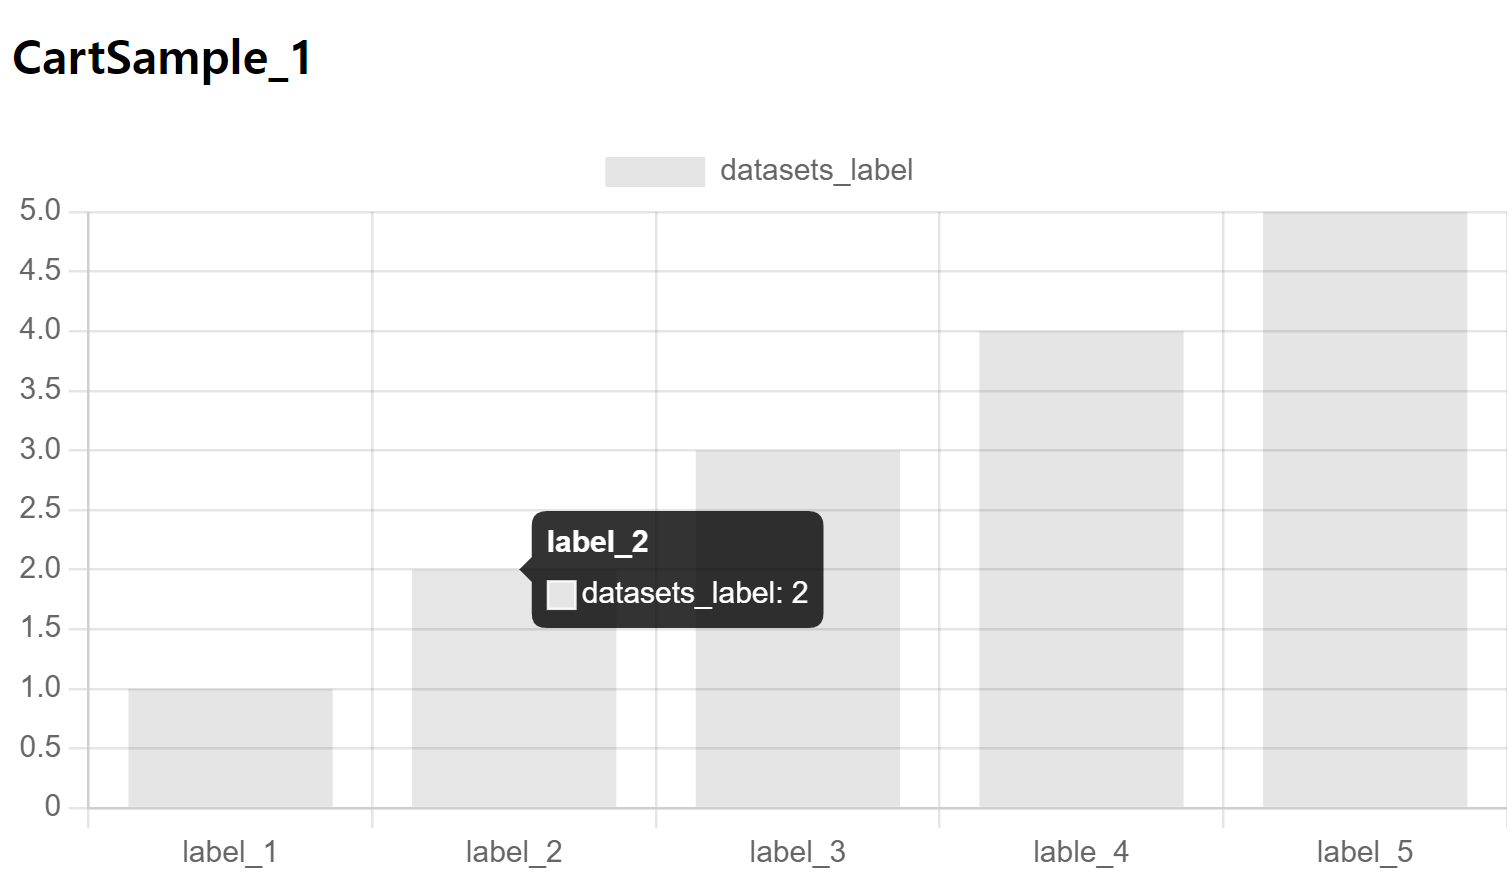
<h3>CartSample_1</h3>
<div>
<canvas id="cartSample_1"></canvas>
</div>
<!-- chart.js -->
<script src="https://cdn.jsdelivr.net/npm/chart.js@3.7.1/dist/chart.min.js"></script>
<script>
const cart_1 = document.getElementById("cartSample_1");
new Chart(cart_1, {
type: "bar",
data: {
labels: ["label_1", "label_2", "label_3", "lable_4", "label_5"],
datasets: [{
label: "datasets_label",
data: [1,2,3,4,5],
borderWith: 1
}]
},
options: {
scales: {
y: {
beginAtZero: true
}
}
}
});
</script>
>> 실행
-- 커서를 막대그래프에 올리면 data의 몇 번 째 라벨인지, datasets에 설정한 label 과 값이 출력된다.
-- canvas 태그 내에 내용을 작성하는 경우 대체 콘텐츠로 사용할 수 있다.(태그로 작성해야 함)
---- <p>대체가능한 텍스트입니다.</p>
-- aria-label : 이미지를 이용해 시각적 표현을 하는 경우 대체 텍스트 역할을 한다.
---- role 속성도 비슷한 역할을 함
[ 색상 ]
-- backgroundColor : 배경색 default: rgba(0, 0, 0, 0.1)
-- borderColor : 테두리 색상 default: rgba(0, 0, 0, 0.1)
-- color : 글꼴 색상 default: #666
// 기본 색상 재설정
Chart.defaults.backgrounColor = "";
Chart.defaults.borderColor = "";
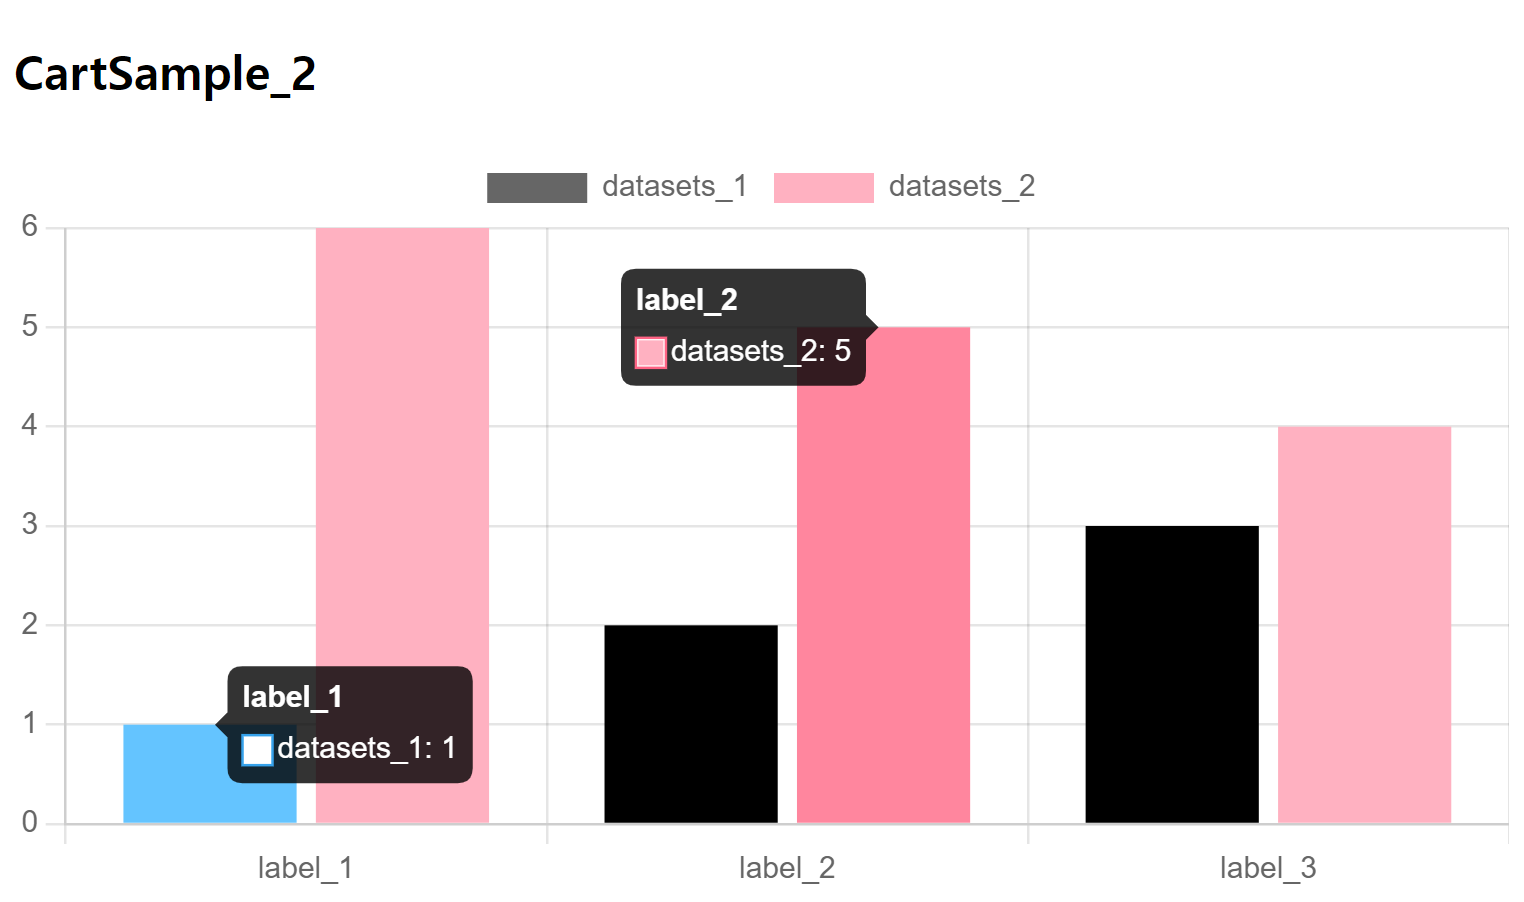
Chart.defaults.color = "";<h3>CartSample_2</h3>
<div>
<canvas id="cartSample_2"></canvas>
</div>
<script>
const cart_2 = document.getElementById("cartSample_2");
new Chart(cart_2, {
type: "bar",
data: {
labels: ["label_1", "label_2", "label_3"],
datasets: [{
label: "datasets_1",
data: [1,2,3],
borderWith: 1,
borderColor: "#36A2EB",
backgroundColor: "#9BD0FS"
},
{
label: "datasets_2",
data: [6,5,4],
borderWith: 1,
borderColor: "#FF6384",
backgroundColor: "#FFB1C1"
}]
},
options: {
scales: {
y: {
beginAtZero: true
}
}
}
});
</script>
>> 실행
[ 데이터 구조 ]
-- 프리미티브 []
data가 숫자 배열인 경우, 인덱스에 있는 배열의 값이 인덱스 축에 사용
<h3>CartSample_3-1</h3>
  <div>
  	<canvas id="cartSample_3_1"></canvas>
  </div>

<script>
	const cart_3_1 = document.getElementById("cartSample_3_1");
	new Chart(cart_3_1, {
		type: "line",
		data: {
			labels: ['a', 'b'],
			datasets: [{
				label: "cart_3-1",
				data: [20, 10],
			}]
		}
	});
</script>
>> 실행
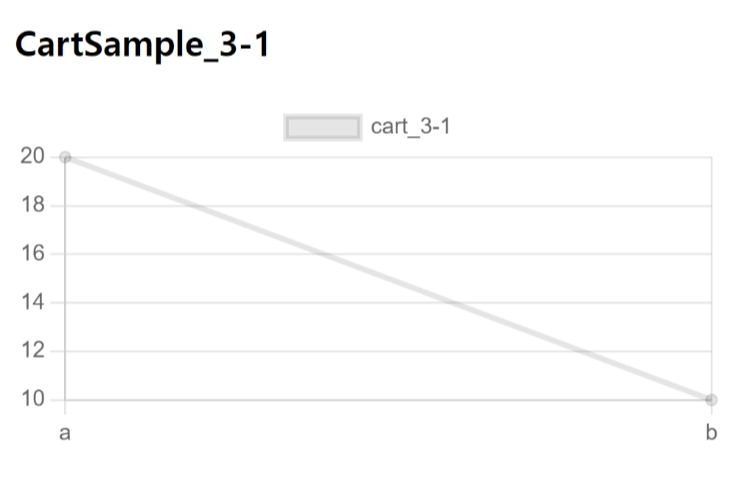
-- 개체[]
구문 분석 데이터에 사용되는 형식
-- y 축에 null이 들어가면 연결이 끊어지는 듯 싶다.
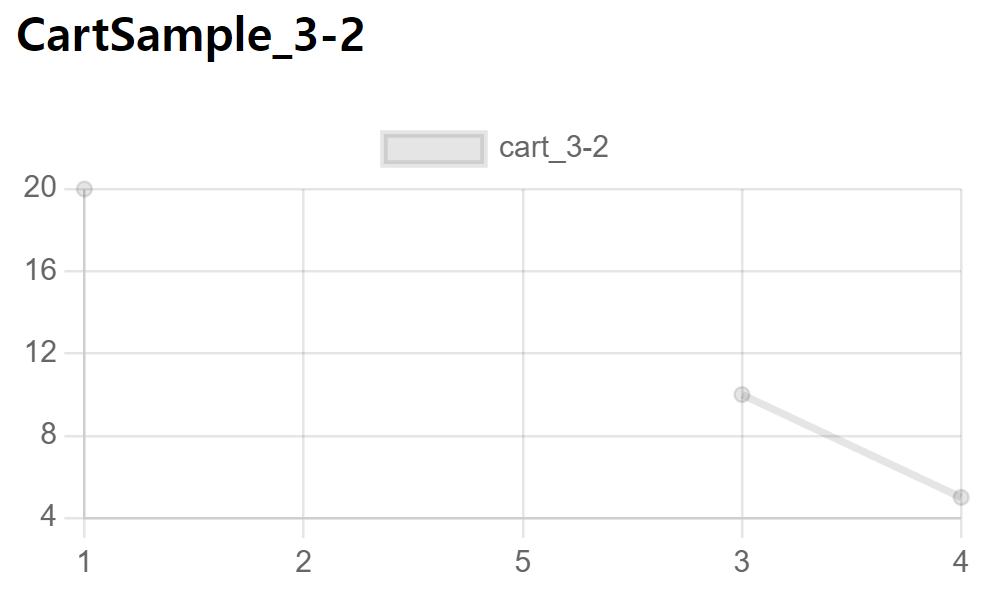
<h3>CartSample_3-2</h3>
  <div>
  	<canvas id="cartSample_3_2"></canvas>
  </div>

<script>
	const cart_3_2 = document.getElementById("cartSample_3_2");
	new Chart(cart_3_2, {
		type: "line",
		data: {
			datasets: [{
				label: "cart_3-2",
                	//시도 1
				data: [{x: 10, y: 20}, {x: 15, y: null}, {x: 20, y: 10}, {x: 5, y: 5}],

                	//시도 2
                		data: [{x: "1", y: 20}, {x: "2", y: null}, {x: "5", y: null}, {x: "3", y: 10}, {x: "4", y: 5}]
			}]
		}
	});
</script>
>> 실행
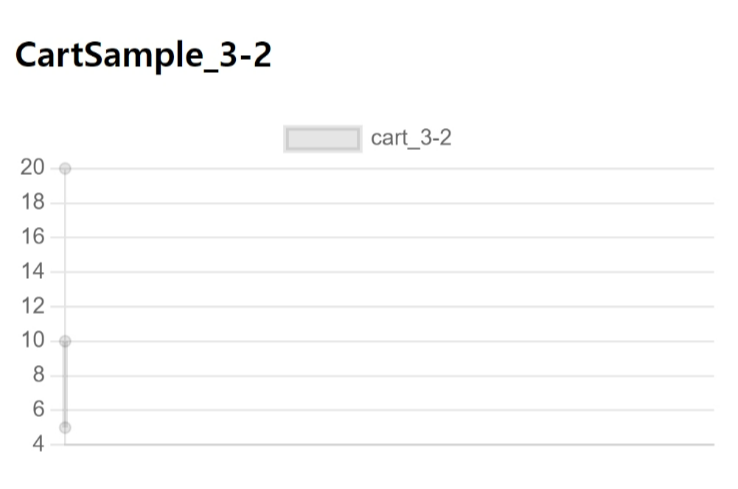
-- x 축 지정
<h3>CartSample_3-3</h3>
  <div>
  	<canvas id="cartSample_3_3"></canvas>
  </div>

<script>
	const cart_3_3 = document.getElementById("cartSample_3_3");
	new Chart(cart_3_3, {
		type: "line",
		data: {
			datasets: [{
				label: "cart_3-3",
				data: [{x: '2024-02-02', y: 20}, {x: '2024-02-12', y: 10}, {x: '2024-02-22', y: 5}]
			}]
		}
	});
</script>
>> 실행

<h3>CartSample_3-4</h3>
  <div>
  	<canvas id="cartSample_3_4"></canvas>
  </div>

<script>
	const cart_3_4 = document.getElementById("cartSample_3_4");
	new Chart(cart_3_4, {
		type: "bar",
		data: {
			datasets: [{
				label: "cart_3-4",
				data: [{x: 'Sales', y: 20}, {x: 'Revenue', y: 10}]
			}]
		}
	});
</script>
>> 실행

-- Object[]
사용자가 직접 속성을 지정할 수 있다.
<h3>CartSample_4-1</h3>
  <div>
  	<canvas id="cartSample_4_1"></canvas>
  </div>

<script>
	const cart_4_1 = document.getElementById("cartSample_4_1");
	new Chart(cart_4_1, {
		type: "bar",
		data: {
			datasets: [{
				label: "cart_4_1",
				data: [
                            		{id: "id_1", nested:{value: 1500}},
                            		{id: "id_2", nested: {value: 500}}
                          	]
			}]
		},
		options: {
			parsing: {
				xAxisKey: "id",
				yAxisKey: "nested.value"
			}
		}
	});
</script>
>> 실행

-- 도넛 형 데이터는 key를 지정해야 한다.
<h3>CartSample_4-2</h3>
  <div>
  	<canvas id="cartSample_4_2"></canvas>
  </div>

<script>
	const cart_4_2 = document.getElementById("cartSample_4_2");
	new Chart(cart_4_2, {
		type: "doughnut",
		data: {
			datasets: [{
				label: "cart_4_2",
				data: [
                            		{id: "id_1", nested:{value: 1500}},
                            		{id: "id_2", nested: {value: 500}}
                          	]
			}]
		},
		options: {
			parsing: {
				key: "nested.value"
			}
		}
	});
</script>
>> 실행

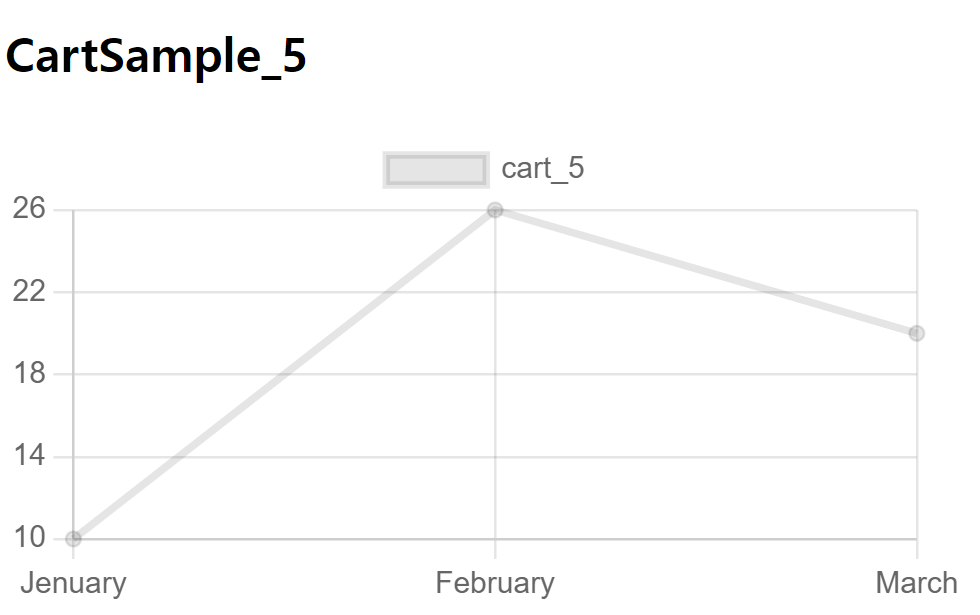
객체
속성 이름이 x축, 값이 y축에 사용된다.
<h3>CartSample_5</h3>
  <div>
  	<canvas id="cartSample_5"></canvas>
  </div>

<script>
	const cart_5 = document.getElementById("cartSample_5");
	new Chart(cart_5, {
		type: "line",
		data: {
			datasets: [{
				label: "cart_5",
				data: {
					Jenuary: 10,
					February: 26,
					March: 20
				}
			}]
		}
	});
</script>
>> 실행
[ 데이터 세트 구성 ]
label : 범례/도구 설명에 표시되는 레이블
clip : chartArea를 기준으로 자르는 방법(양수 : 오버플로를 허용 / 음수: 내부의 픽셀을 자름)
order : 데이터 집합 그리기의 순서(스택, 툴팁, 범례 순서에 영향)
stack : 데이터 세트가 속한 그룹의 id(default : dataset)
parsing : 구문 분석하는 방법 (비활성화 가능_false > 유형/척도가 내부적으로 사용하는 형식으로 정렬)
hidden : 데이터 세트의 표시 유형 구성(렌더링 되지 않도록 숨겨준다)
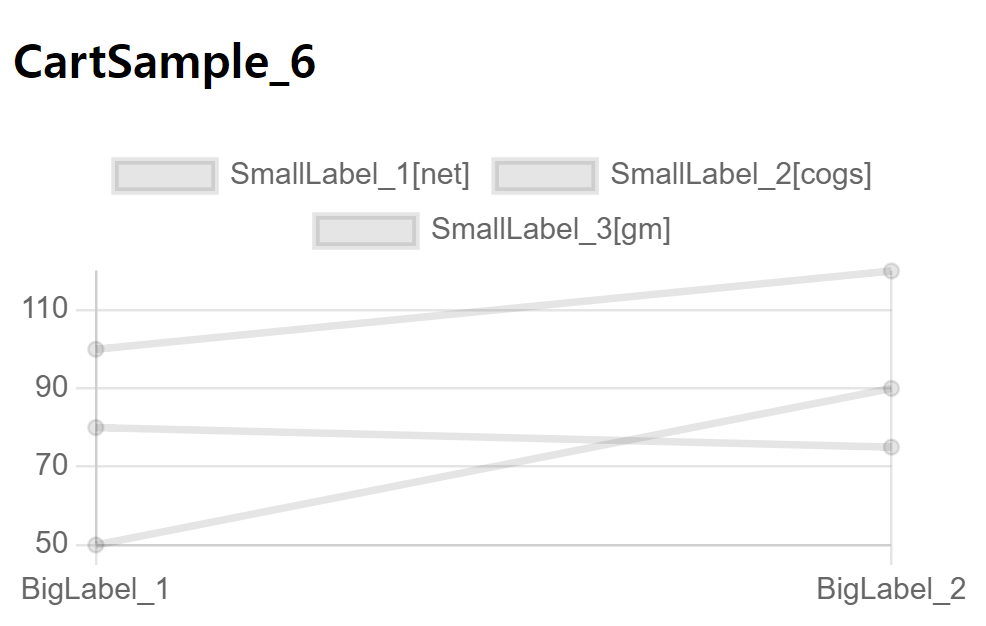
<h3>CartSample_6</h3>
  <div>
  	<canvas id="cartSample_6"></canvas>
  </div>

<script>
	const cart_6 = document.getElementById("cartSample_6");
	const data = [{x: 'BigLabel_1', net: 100, cogs: 50, gm: 80},
    			{x: 'BigLabel_2', net: 120, cogs: 90, gm: 75}];

	new Chart(cart_6, {
		type: "line",
		data: {
			labels: ["BigLabel_1", "BigLabel_2"],
			datasets: [{
				label: "SmallLabel_1[net]",
				data: data,
				parsing: {
					yAxisKey: 'net'
				}
			},{
				label: "SmallLabel_2[cogs]",
				data: data,
				parsing: {
					yAxisKey: 'cogs'
				}
			},{
				label: "SmallLabel_3[gm]",
				data: data,
				parsing: {
					yAxisKey: 'gm'
				}
			}
			]
		}
	});
</script>
>> 실행
[ 폰트 ]
|
// 텍스트 기본 글꼴 크기
Chart.defaults.font.size = //default: 12;
// 텍스트의 기본 글꼴
Chart.defaults.font.family = //default: 'Helvetica Neue', 'Helvetica', 'Arial', sans-serif
// 텍스트의 기본 글꼴 스타일
Chart.defaults.font.style = //default: normal [normal, italic, oblique, initial, inherit]
// 기본 글꼴 두께
Chart.defaults.font.weight = //default: undefined [normal, bold, lighter, bolder, number]
// 개별 텍스트 줄 높이
Chart.defaults.font.lineHeight = //default: 1.2
|
>> 사용자 지정
<h3>CartSample_7</h3>
<div>
	<canvas id="cartSample_7"></canvas>
</div>

<script>
	const cart_7 = document.getElementById("cartSample_7");
	const data2 = {
		labels: [
			'Red',
			'Blue',
			'Yellow'
		],
		datasets: [{
			label: 'My First Dataset',
			data: [300, 50, 100],
			backgroundColor: [
				'rgb(255, 99, 132)',
				'rgb(54, 162, 235)',
				'rgb(255, 205, 86)'
			],
			hoverOffset: 4
		}]
	};
	//Note: changes to the plugin code is not reflected to the chart, because the plugin is loaded at chart construction time and editor changes only trigger an chart.update().
	const plugin = {
		id: 'customCanvasBackgroundColor',
		beforeDraw: (chart, args, options) => {
			const {ctx} = chart;
			ctx.save();
			ctx.globalCompositeOperation = 'destination-over';
			ctx.fillStyle = options.color || '#99ffff';
			ctx.fillRect(0, 0, chart.width, chart.height);
			ctx.restore();
		}
	};
	const config = {
		type: 'doughnut',
		data: data2,
		options: {
			plugins: {
				customCanvasBackgroundColor: {
					color: 'ivory',
				}
			}
		},
		plugins: [plugin],
	};

	new Chart(cart_7, config);
</script>
>> 실행
'Project_WEATHERWEAR' 카테고리의 다른 글
| reProject_52_Chart.js 활용하여 통계 구현하기_2 (0) | 2024.02.26 |
|---|---|
| reProject_50_상품 주문 완료 시, 주문 내역 이메일 보내기 구현 (0) | 2024.02.22 |
| reProject_49_JAVA/SPRING SMS 문자 보내기 기능 구현 (0) | 2024.02.22 |
| reProject_48_관리자 주문 페이지, 교환/환불 요청 확인, 교환/환불 처리, 아임포트 환불 처리(부분 취소/전액 취소) (0) | 2024.02.21 |
| reProject_47_리뷰 작성, 리뷰 삭제, 별점, 리뷰 상세 보기 기능 구현 (0) | 2024.02.20 |


